Report covers finances from May 1, 2016 to April 30, 2017
Aaron Panciera NEWS EDITOR
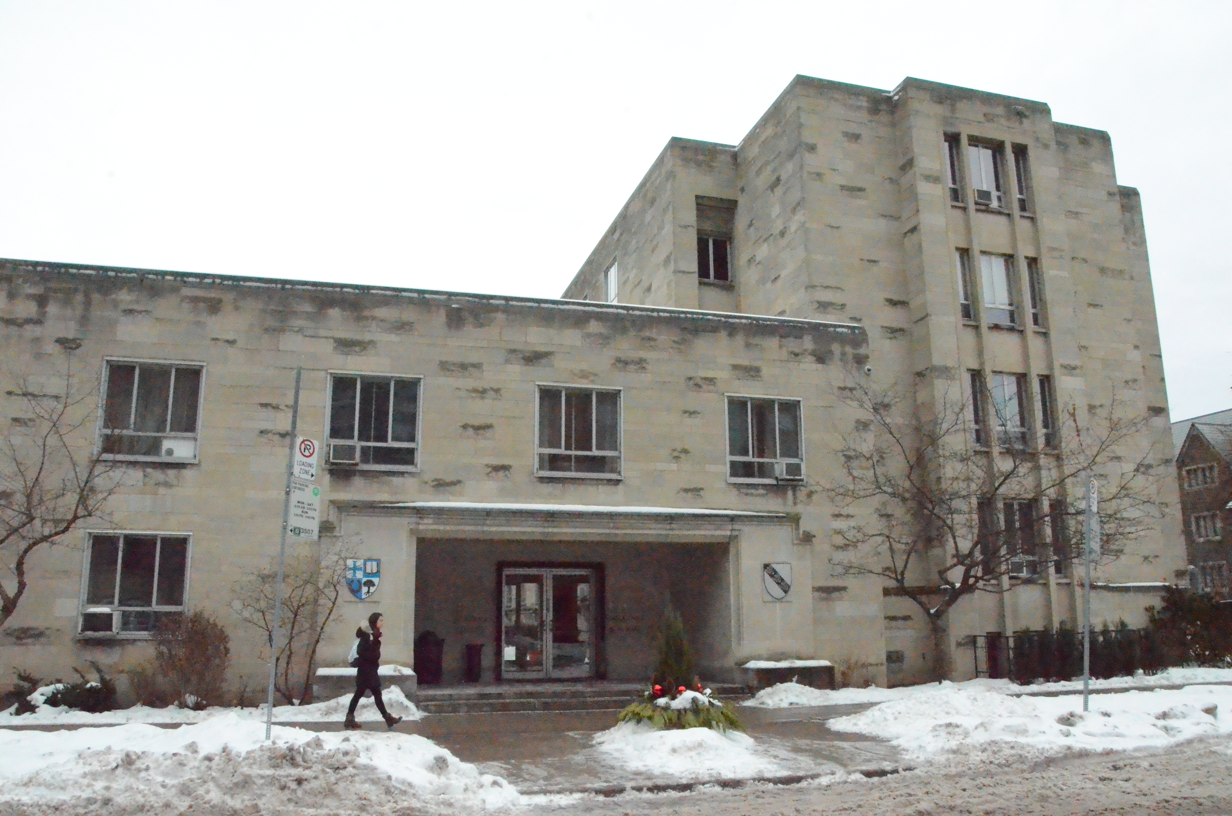
Photo: Yoav Simoni / THE MIKE.
The University of St. Michael’s College (USMC) released their Audited Financial Report in the fall of 2017. The report details assets, expenditures, and other financial dealings of the college as at April 30, 2017.
The report is one detailing sound and transparent monetary dealings from the period of May 1, 2016 to April 30, 2017.
“In our opinion, the financial statements present fairly, in all material respects, the financial position of The University of St. Michael’s College as at April 30, 2017 and the results of its operation and its cash flows for the year then ended in accordance with Canadian accounting standards for not-for-profit organizations,” the auditor’s report read.
Balance Sheet
In any balance sheet for a non-profit (such as USMC), there are three major components: assets, liabilities, and net assets. In this situation, the monetary value of assets must equal that of liabilities plus net assets, as net assets denote only the difference between assets and liabilities. Assets are defined as items owned by the college that have monetary value such as cash and investments. Liabilities are defined as essentially what the colleges owes. This can include bank indebtedness, deferred revenue, etc.
For the 2017 fiscal year, USMC’s total assets added up to $147,483,000, an almost 10% increase from the $134,386,000 in assets for the year of 2016. Liabilities were relatively flat from the prior year with total liabilities at $55,243,000 (as compared to $55,712,000 in 2016). Net assets, a combination of internally restricted net assets (defined as the amount of capital assets internally funded) plus endowments less accumulated deficits, totaled $92,240,000, which when added to the total liabilities is balanced with total assets.
Ultimately, this is a sign of sound financial standing as, compared to 2016, the monetary value of the college’s assets has risen as the value of its liabilities have fallen. This has not always been the case, as from 2015 to 2016 the value of assets decreased while the value of liabilities increased. However, the positive change from 2016 to 2017 implies progress.
Revenue and Expenses
The total revenue for the year came to a sum of ($27,216,000), with the bulk of USMC’s total revenue for the year from student fees ($8,511,000), a block grant from the University of Toronto (U of T) ($5,972,000), grants and donations ($4,531,000), investment income ($3,813,000), and sales and services ($2,616,000).
While some of these revenue streams seem ambiguous by their descriptions, the report contains a section of notes on the finances for the sake of clarification. The block grant from U of T, for example, is an agreement between the university and the college in which USMC gives U of T each year’s tuition payments in exchange for reimbursement in the form of a grant.
This compares favorably to the total expenses of the year, which sum to $24,698,000. These costs are highlighted by: salaries and benefits ($10,478,000), materials and supplies ($4,142,000), cost of sales ($2,932,000), and amortization of capital assets ($2,488,000). The “amortization of capital assets” simply refers to the paying off debt over a long period of time on major expenses such as properties, stocks, bonds, etc.
The difference between these two numbers (after taking into account the change in fair value of interest rate swap) comes out to $2,647,000, which is USMC’s net revenue for the year. This essentially means that, after subtracting total expenses from total revenue, USMC was left with $2,647,000 in extra revenue.
This number is over double the net revenue figure of -$1,180,000 from the period May 1, 2015 to April 30. This improvement can be attributed to increasing investment income while holding expenses relatively flat to 2016 levels.
Statement of Cash Flow
The final major component to the financial statements is the Statement of Cash Flow, which details how the college generated and consumed its cash resources during the year.
For USMC, 2017 saw a large increase in net cash. This is evident in that the college started the fiscal year with $12,000 in net cash,
and ended it with $1,835,000. This was a much bigger change in net cash than seen in previous years, as from 2015-2016 USMC only upped its net cash from $6,000 to $12,000, and 2014-2015 saw no increase in net cash.
This change came from increases in revenue from two key financial aspects: operating activities and financial activities. “Operating activities” refers to the core activities of the college, and “financial activities” refers to anything that provides funds to the college.
These categories provide the bulk of the increased net cash in 2017. The increase from operating activities was primarily driven by the net revenue improvements (+$3,854,000 ahead of the prior year), while increases in endowment contributions (+$1,983,000) drove the financial activity increase. These gains were offset by higher cash usage in investing activities resulting in the net cash increase.
Conclusion
The audited financial statements as at April 30, 2017 suggest an organization on financial upswing, with gains in net revenue, net assets, and net cash. Not only does the college have positive figures in the finances for all major categories, but it is evident that the college has experienced monetary gain over the past few years.


